Problem
Executive performance reporting depended on manual data preparation across multiple operational source systems. This made dashboard refreshes slower, harder to rerun safely, and less consistent across reporting periods.
Project Case Study
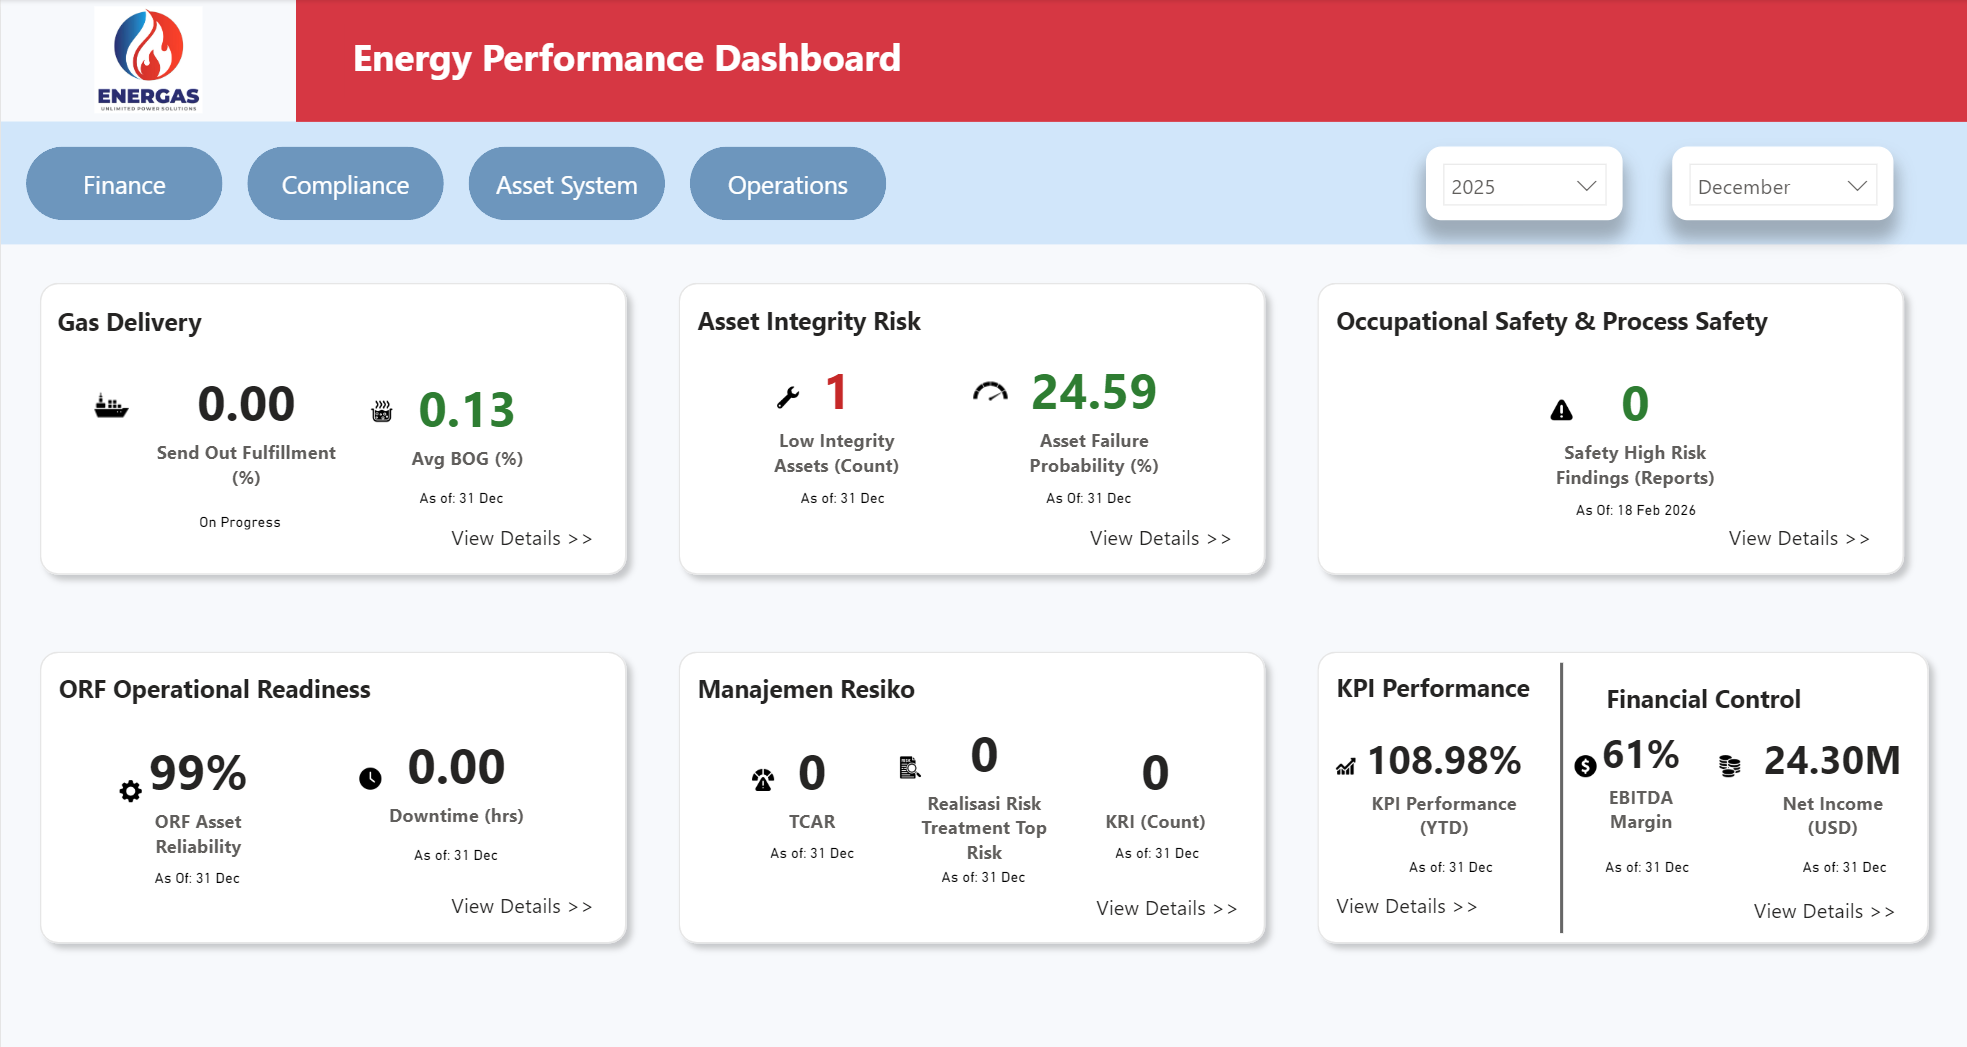
Containerized Airflow and Spark pipeline that extracts operational data, transforms metrics, loads a PostgreSQL data mart, and feeds executive Power BI dashboards.

Executive performance reporting depended on manual data preparation across multiple operational source systems. This made dashboard refreshes slower, harder to rerun safely, and less consistent across reporting periods.
Built a containerized data pipeline for operational performance dashboards using Apache Airflow, Apache Spark, Docker, PostgreSQL, and MSSQL. The workflow automates extraction from multiple source systems, transforms operational metrics, validates and aggregates business logic, and loads dashboard-ready datasets into a centralized PostgreSQL data mart for Power BI.
Reduced manual data preparation and improved the reliability, freshness, and consistency of dashboard reporting, giving executives a cleaner view of performance across reporting periods.